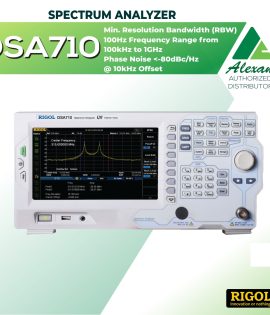
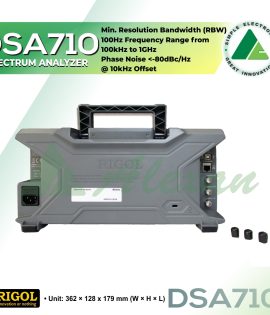
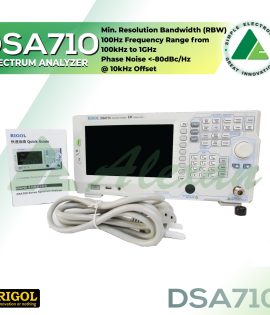
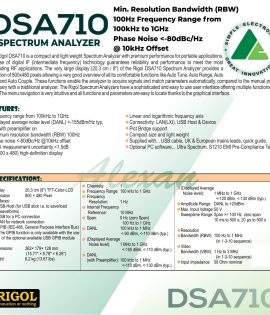
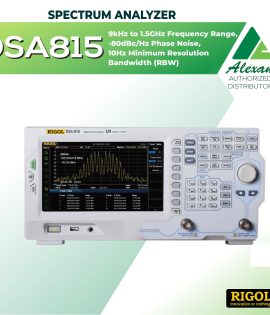
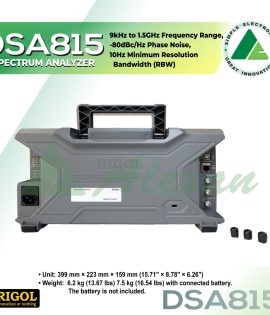
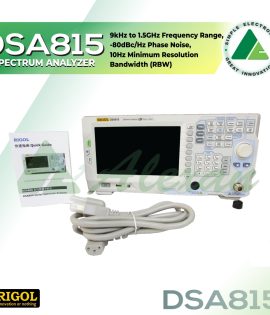
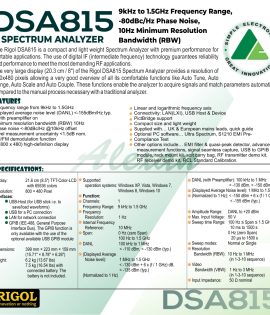
Rigol DSA1030 Spectrum Analyzer, 9kHz-3GHz Bandwidth, 100Hz Minimum Resolution Bandwidth, Quasi-Peak Detector & EMI Filter
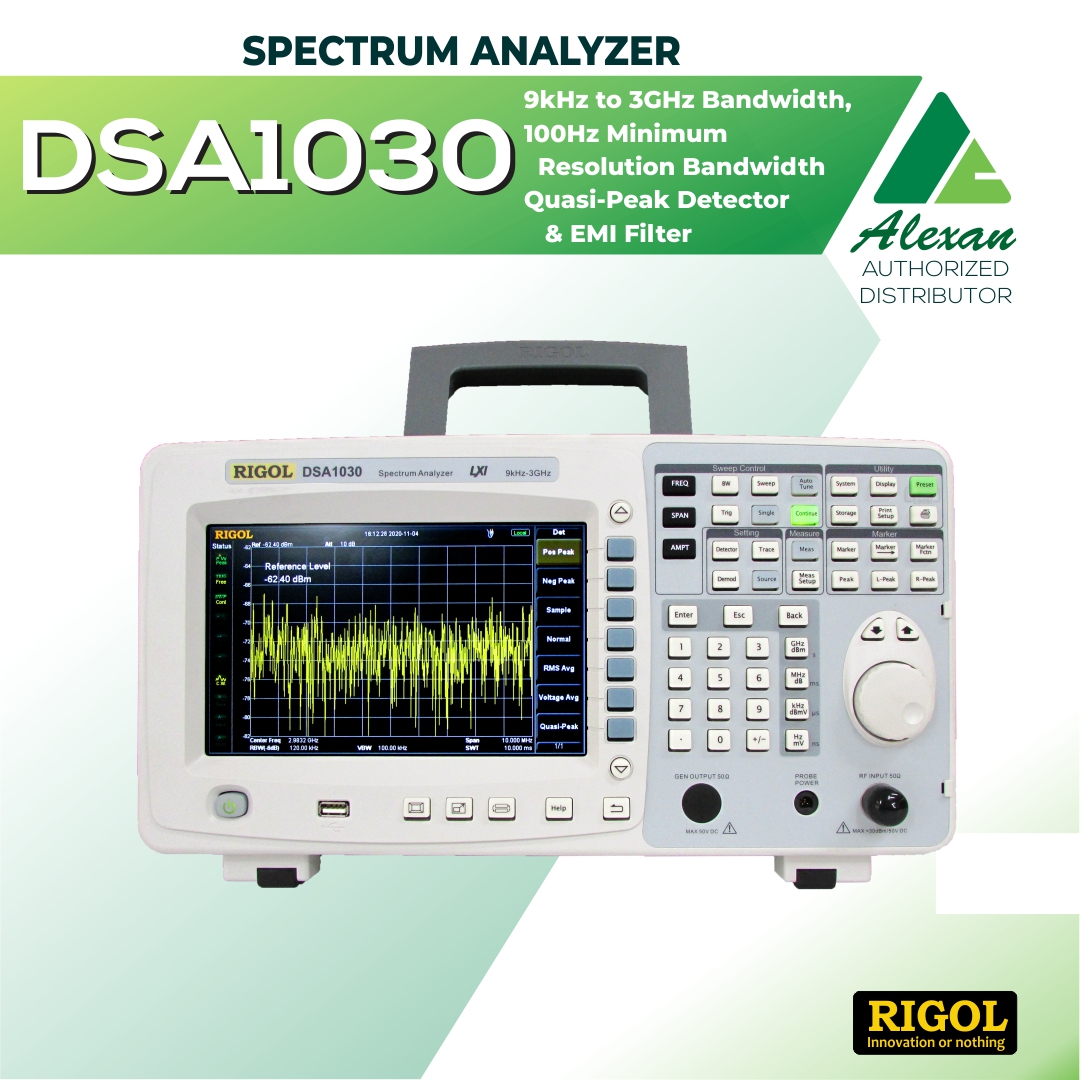
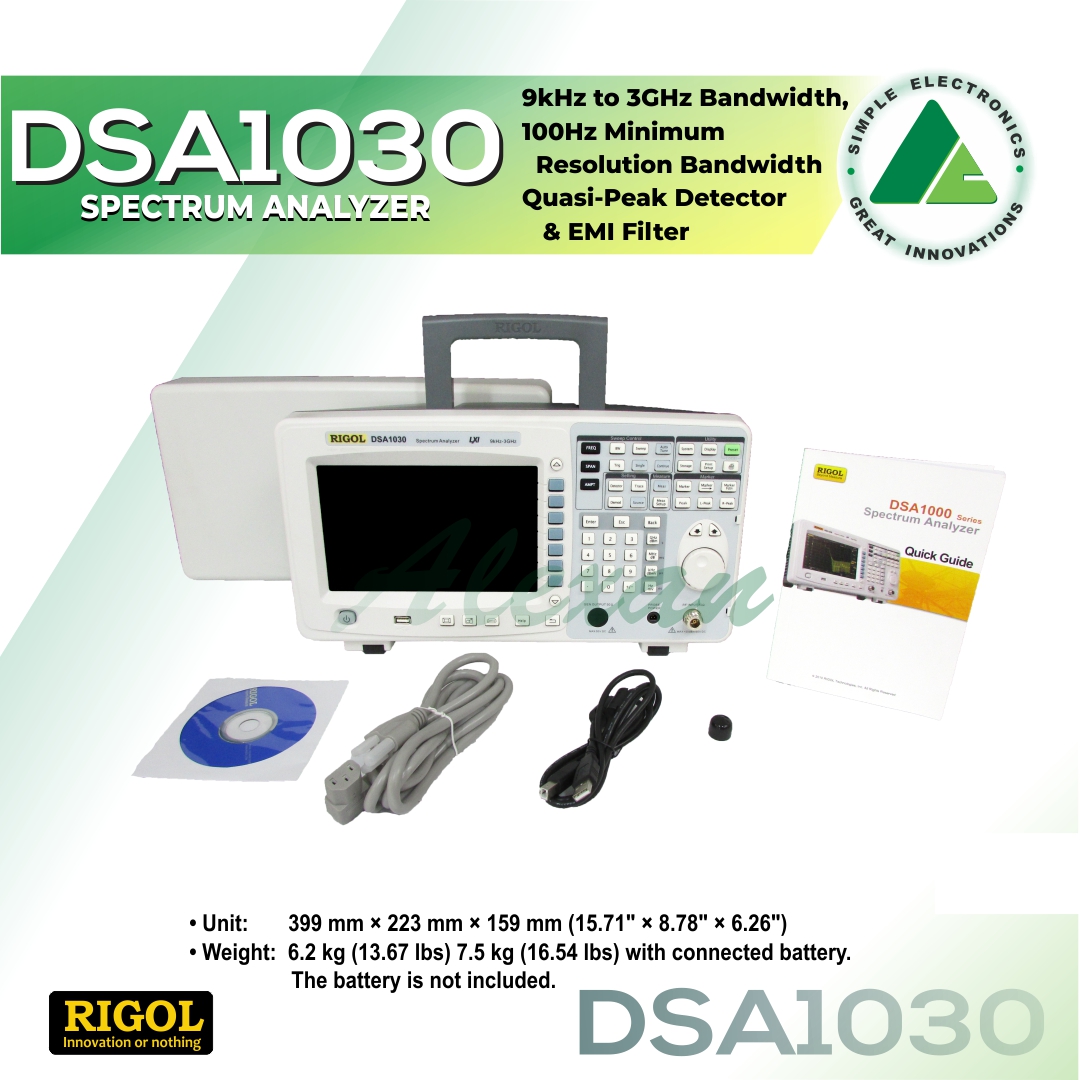
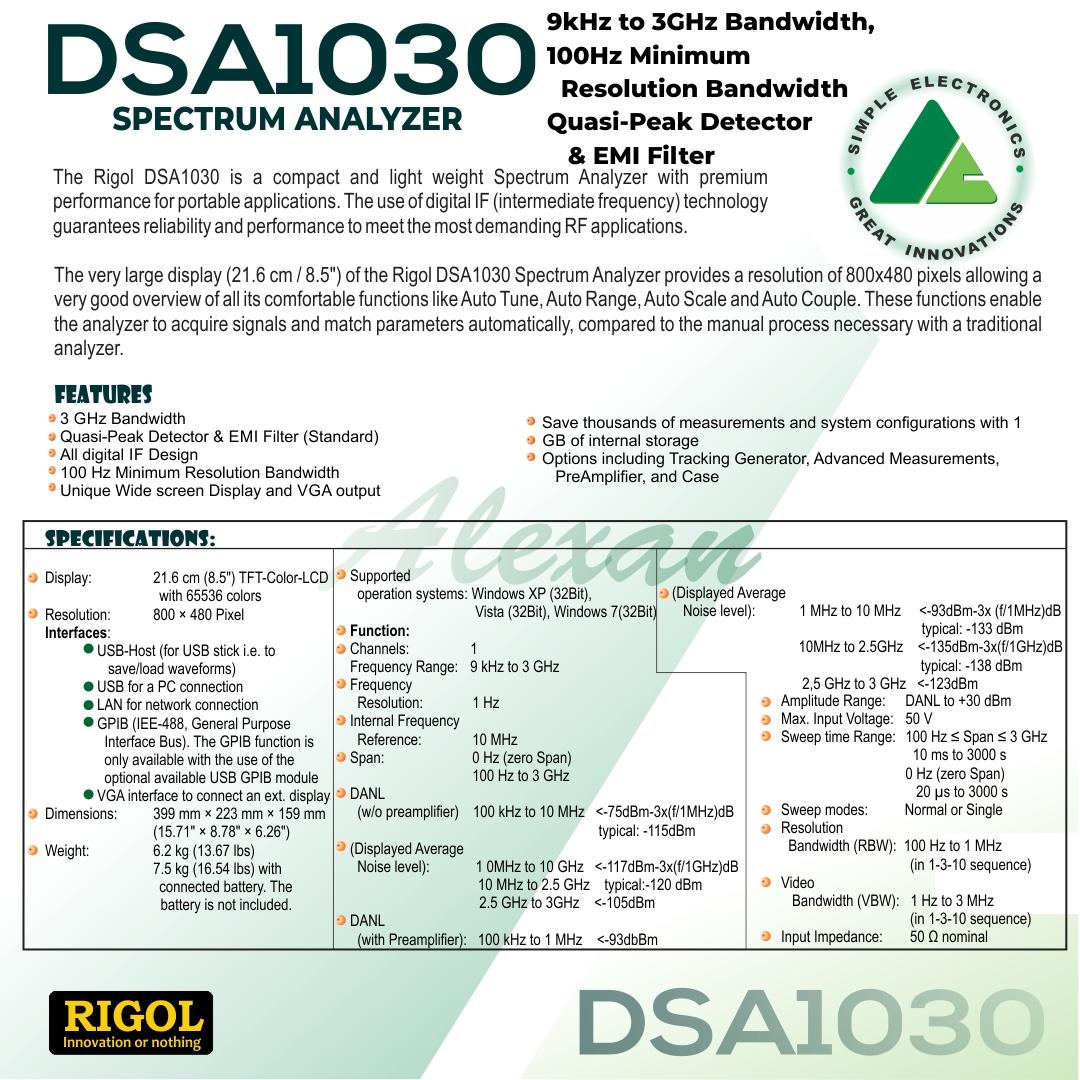
The Rigol DSA1030 is a compact and light weight Spectrum Analyzer with premium performance for portable applications. The use of digital IF (intermediate frequency) technology guarantees reliability and performance to meet the most demanding RF applications.
The very large display (21.6 cm / 8.5″) of the Rigol DSA1030 Spectrum Analyzer provides a resolution of 800×480 pixels allowing a very good overview of all its comfortable functions like Auto Tune, Auto Range, Auto Scale and Auto Couple. These functions enable the analyzer to acquire signals and match parameters automatically, compared to the manual process necessary with a traditional analyzer.
The Rigol Spectrum Analyzers have a sophisticated and easy to use user interface offering multiple functions for all tasks. The menu navigation is very intuitive and all functions and parameters are easy to locate thanks to the graphical interface.
Special Features
– Filesystem and USB Stick Support
– The devices have a filesystem for the storage of waveforms in the internal memory or on USB sticks.
– Integrated Help system
– The integrated help function will show descriptions of single functions and step-by-step instructions for often used tasks.
– LCD Screenshots
– Big Display- The TFT-LCD display is an 21.6 cm (8.5″) widescreen with 800×480 high resolution and fine spectral lines for displaying large data sets. There are 601 display points available in normal and 761 points in full screen mode.
– Clear File System- Instrument settings and waveform data can be saved to or loaded from files in the internal memory of the analyzer or external USB flash devices. The analyzer can make files such as Setting file, Status file, Trace file, Amplitude correction file, Measurement data, Marker table file, Peak table file and Limit file.
– Measurement of peak values- After a peak search all peaks matching the defined parameter conditions are displayed in this peak table (with frequency and amplitude shown). The table can show up to ten peaks at the same time.
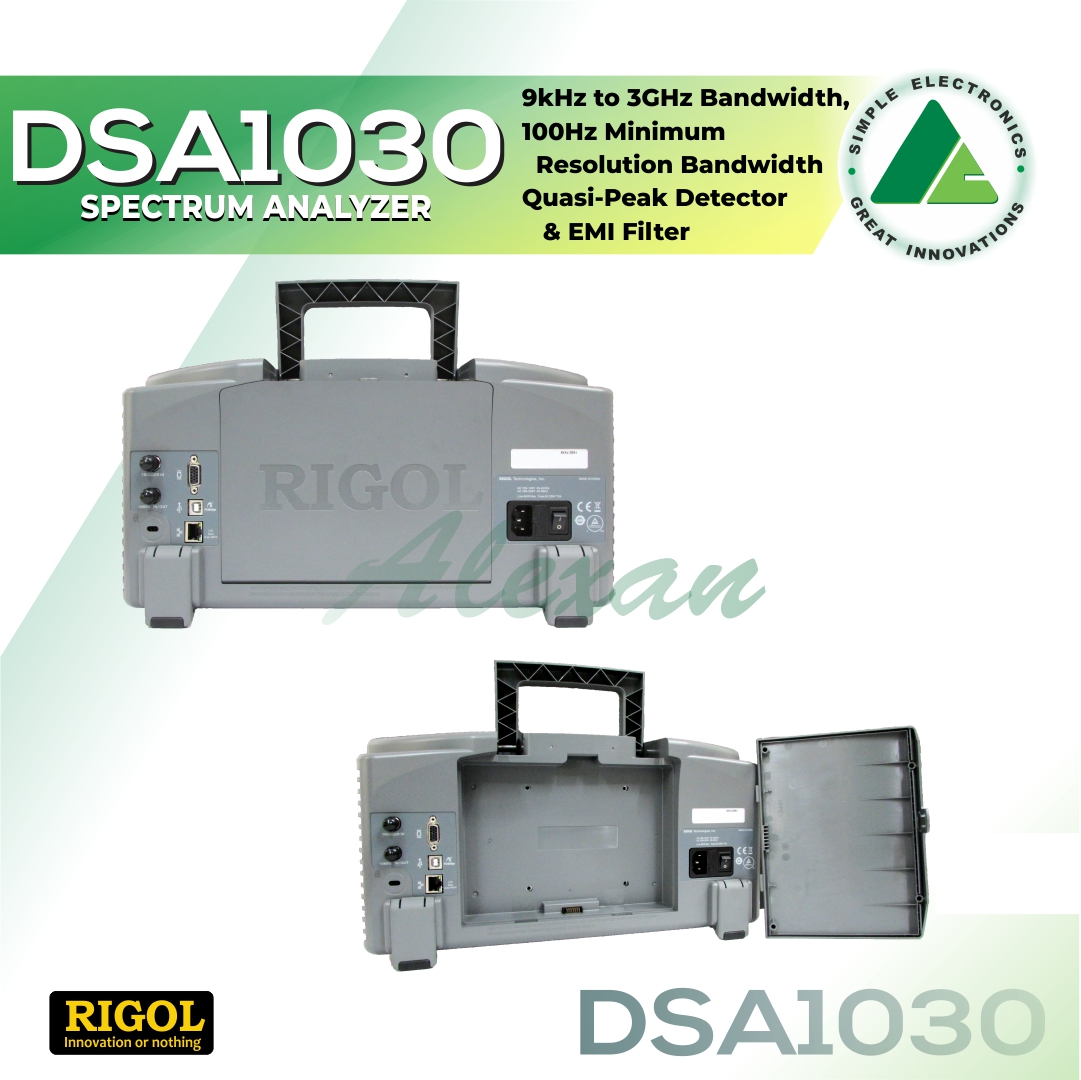
– Detailed Network Configuration- The analyzer supports communications through the LAN, USB and GPIB interface. Both LAN and USB are standard interfaces. Using this comfortable LAN setup every necessary parameter can configured easily.
– Simple use of Markers- This table displays all the opened markers on the lower portion of the screen, including Marker number, Trace number, Trace Type, X-axis, and Amplitude readout. Through this table you can view the measured value from multiple points. The table allows for up to eight markers to be displayed at one time.


